SAN DIEGO ADU PERMITS · THE DATA
Where San Diego is building ADUs.
Every ADU permit project the City of San Diego touched from January 2024 to September 18, 2026, counted by community plan area and ZIP code. 5,818 projects across 45 communities, from the City's own permit records.
THE SHORT ANSWER
Clairemont Mesa, Mid-City: City Heights and Southeastern San Diego lead.
Homeowners filed about 144 ADU permit applications a month in 2024, 154 in 2025 and 117 so far in 2026. The City issued about 121 permits a month in 2024, 109 in 2025 and 106 so far in 2026, counting complete months through August 2026. The median project took 235 days from application to permit, about 8 months, and the median declared construction value was $143,000.
Check my property- ADU permit projects
- 5,818 January 2024 to September 18, 2026
- Applications filed
- 4,577 since January 2024
- Permits issued
- 3,653 since January 2024
- Median time to permit
- 235 days half faster, half slower; a quarter took over 420 days
- Median declared value
- $143,000 what applicants declared on 5,099 permits
- Units permitted
- 7,499 ADUs and junior ADUs, where the permit states a count
By year
| Year | Applications filed | Permits issued |
|---|---|---|
| 2024 | 1,724 | 1,452 |
| 2025 | 1,851 | 1,311 |
| 2026, to September 18 | 1,002 | 890 |
Complete months only. September 2026 so far: 64 applications, 45 permits issued.
See the monthly numbers
| Month | Applications | Permits issued |
|---|---|---|
| January 2024 | 139 | 113 |
| February 2024 | 132 | 111 |
| March 2024 | 139 | 132 |
| April 2024 | 144 | 161 |
| May 2024 | 161 | 139 |
| June 2024 | 159 | 123 |
| July 2024 | 147 | 114 |
| August 2024 | 130 | 142 |
| September 2024 | 145 | 103 |
| October 2024 | 122 | 108 |
| November 2024 | 167 | 110 |
| December 2024 | 139 | 96 |
| January 2025 | 171 | 96 |
| February 2025 | 155 | 115 |
| March 2025 | 174 | 106 |
| April 2025 | 154 | 116 |
| May 2025 | 145 | 116 |
| June 2025 | 179 | 103 |
| July 2025 | 168 | 115 |
| August 2025 | 156 | 124 |
| September 2025 | 146 | 95 |
| October 2025 | 134 | 129 |
| November 2025 | 98 | 88 |
| December 2025 | 171 | 108 |
| January 2026 | 126 | 127 |
| February 2026 | 124 | 99 |
| March 2026 | 124 | 135 |
| April 2026 | 96 | 114 |
| May 2026 | 114 | 98 |
| June 2026 | 120 | 91 |
| July 2026 | 130 | 96 |
| August 2026 | 104 | 85 |
THE MAP
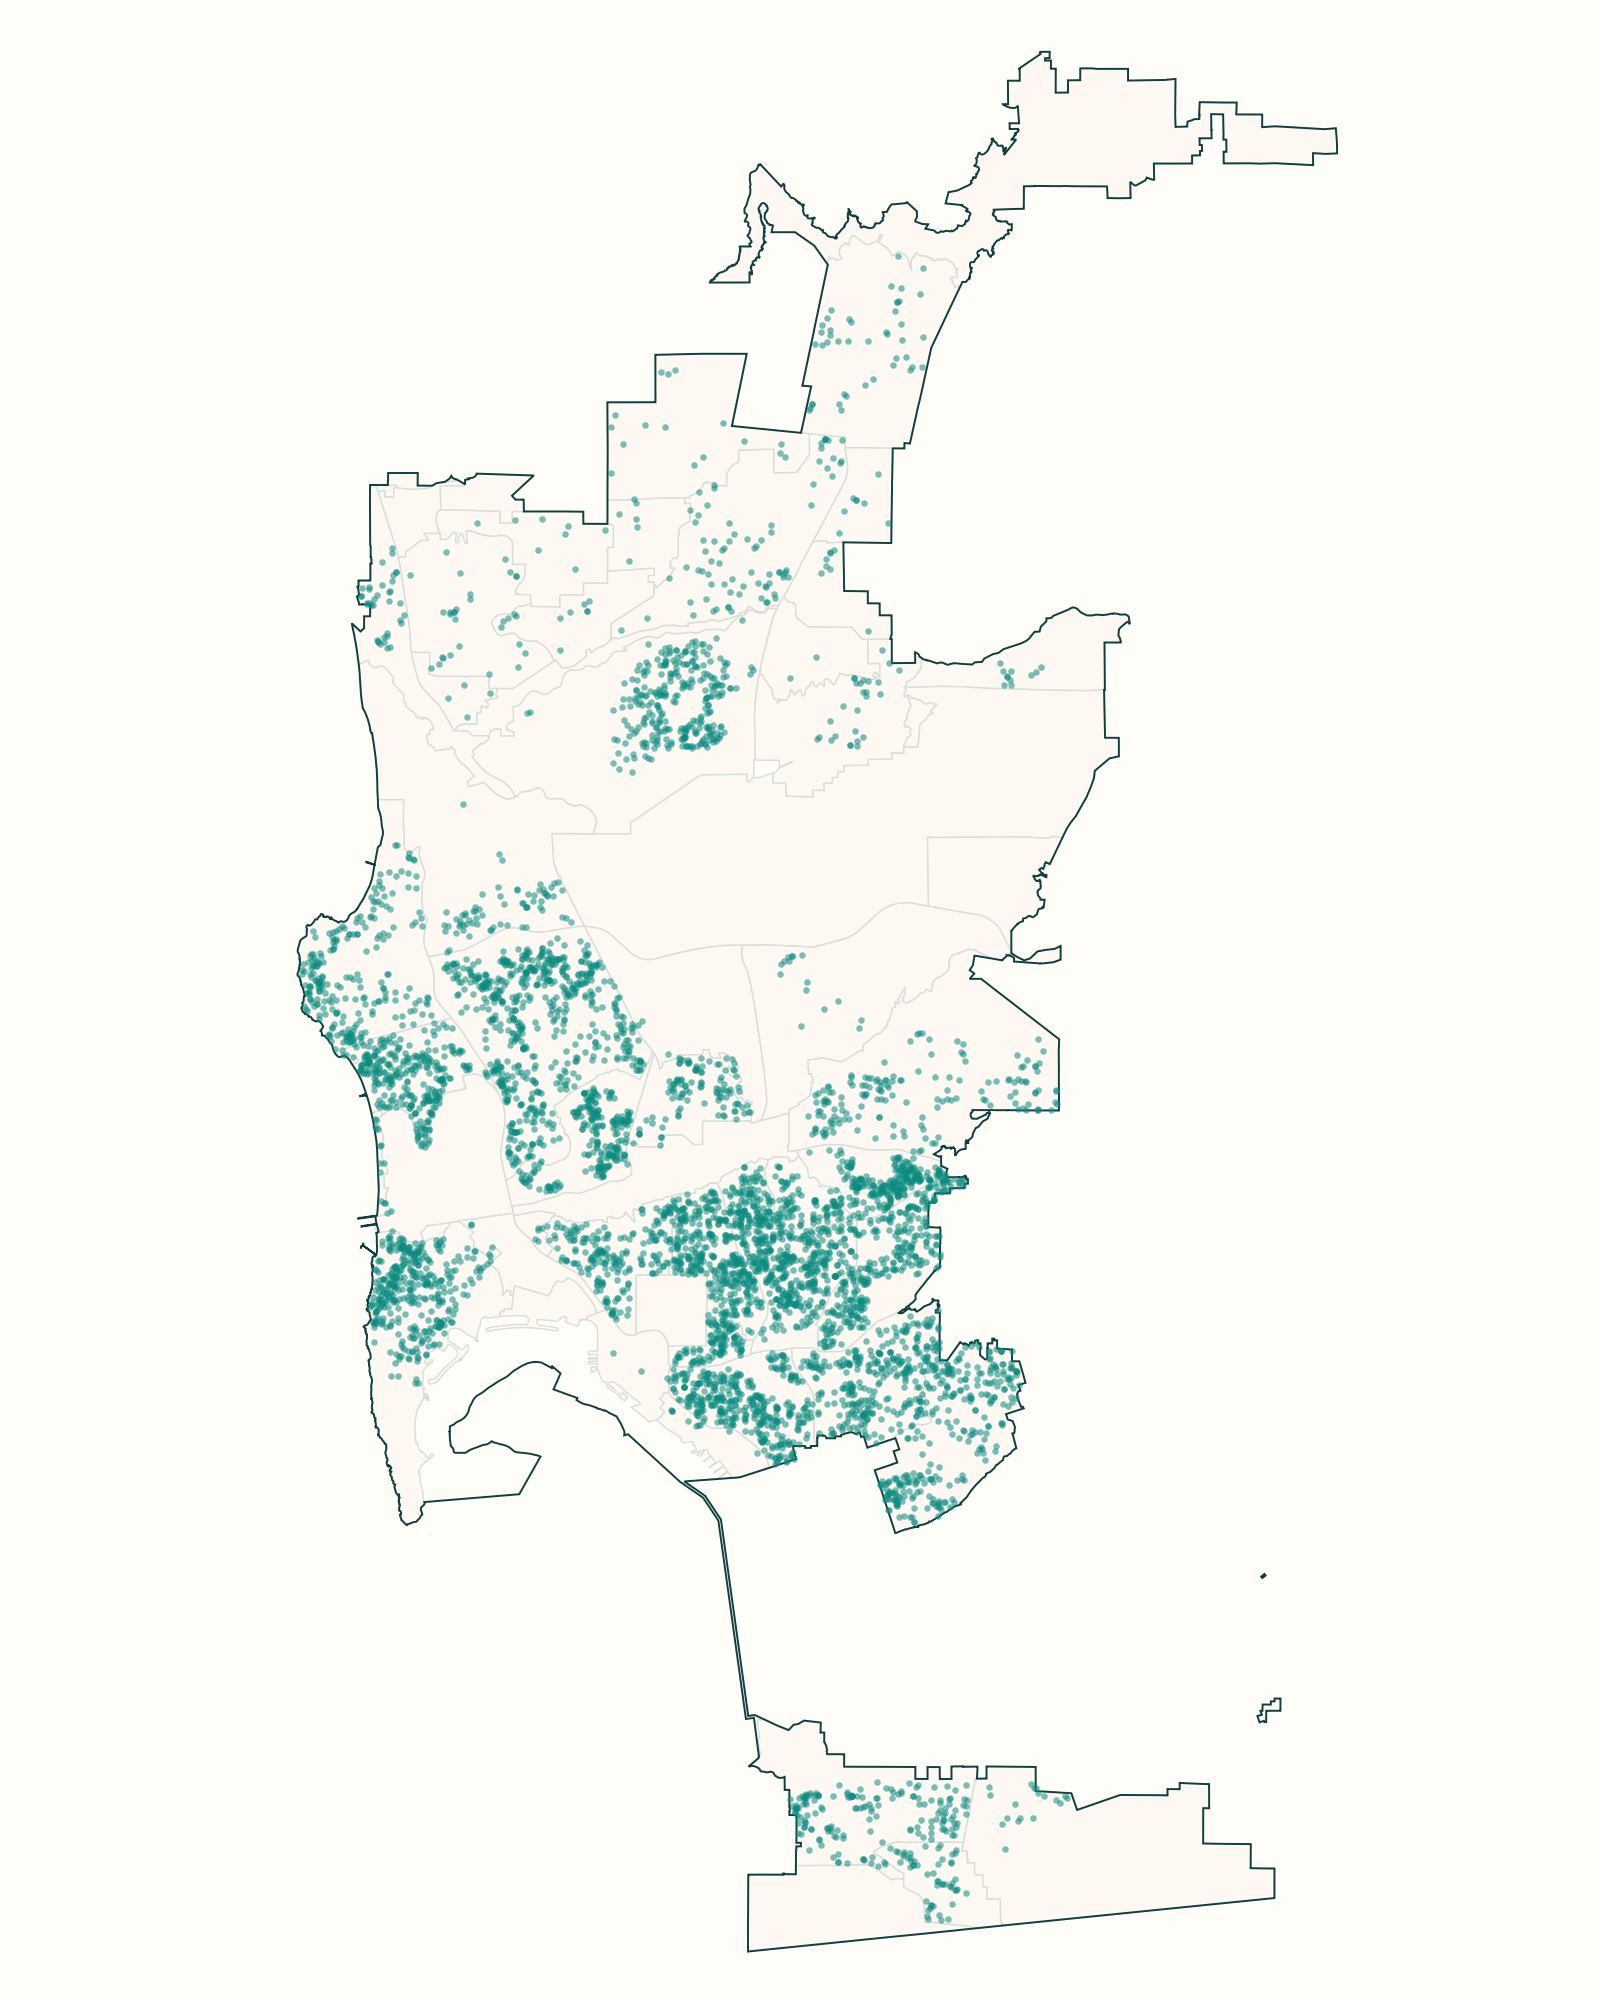
One dot per project.
The dots follow the older single-family neighborhoods: Clairemont, the Mid-City communities, North Park, Southeastern San Diego and the beach communities. The newer master-planned areas north of Miramar barely register, and the largest lots in the city carry the fewest permits.
The outline is the City limit. The lighter lines are the City's community plan areas, which is how the tables below group the counts.
Check your own property to see what could fit, or compare ADU floor plans that suit these lots.
BY COMMUNITY PLAN AREA
45 communities, ranked by projects.
Applications and permits issued count from January 2024. Median time runs from the application date to the issue date for permits issued in the window. Median value is what applicants declared on the permit, not a construction cost. Conversion is the share of projects whose scope describes converting an existing garage or room. 4 projects have permit coordinates outside every community plan area and appear only in the ZIP table.
| Community plan area | ZIPs | Projects | Applications | Permits issued | Median days | Median value | Conversion |
|---|---|---|---|---|---|---|---|
| Clairemont Mesa | 92117 92111 92110 | 609 | 472 | 405 | 225 | $149,000 | 36% |
| Mid-City: City Heights | 92105 92104 92115 | 401 | 319 | 249 | 251 | $126,000 | 46% |
| Southeastern San Diego | 92113 92102 | 385 | 304 | 207 | 324 | $162,000 | 37% |
| North Park | 92104 92116 92103 | 352 | 261 | 212 | 290 | $132,000 | 51% |
| Encanto Neighborhoods | 92114 92102 92113 | 321 | 263 | 167 | 249 | $152,000 | 35% |
| Pacific Beach | 92109 92102 | 301 | 232 | 192 | 275 | $185,000 | 37% |
| Mid-City: Eastern Area | 92115 92105 92102 | 295 | 242 | 204 | 210 | $148,000 | 39% |
| Mira Mesa | 92126 92121 92129 | 292 | 243 | 214 | 176 | $144,000 | 29% |
| Peninsula | 92107 92106 92110 | 278 | 214 | 172 | 250 | $157,000 | 37% |
| Skyline-Paradise Hills | 92114 92139 | 267 | 207 | 155 | 239 | $122,000 | 42% |
| College Area | 92115 92120 | 266 | 212 | 195 | 219 | $198,000 | 42% |
| La Jolla | 92037 | 237 | 190 | 134 | 243 | $180,000 | 34% |
| Linda Vista | 92111 92110 92102 | 222 | 176 | 132 | 267 | $206,000 | 25% |
| Uptown | 92103 92116 92101 | 215 | 154 | 141 | 296 | $125,000 | 48% |
| Otay Mesa-Nestor | 92154 92173 | 164 | 134 | 97 | 205 | $98,000 | 53% |
| Navajo | 92120 92119 92103 | 162 | 141 | 108 | 157 | $106,000 | 46% |
| Mid-City: Normal Heights | 92116 92104 92105 | 138 | 95 | 90 | 259 | $106,000 | 54% |
| Greater Golden Hill | 92102 92104 | 117 | 84 | 75 | 413 | $127,000 | 46% |
| Serra Mesa | 92123 | 111 | 92 | 74 | 186 | $124,000 | 43% |
| Ocean Beach | 92107 | 103 | 84 | 60 | 236 | $142,000 | 38% |
| Mid-City: Kensington-Talmadge | 92115 92116 92105 | 99 | 74 | 68 | 270 | $94,000 | 55% |
| Rancho Penasquitos | 92129 | 76 | 66 | 46 | 178 | $127,000 | 26% |
| University | 92122 92111 | 69 | 50 | 49 | 178 | $132,000 | 36% |
| San Ysidro | 92173 | 54 | 46 | 32 | 218 | $107,000 | 46% |
| Rancho Bernardo | 92128 92127 | 44 | 35 | 27 | 189 | $105,000 | 39% |
| Torrey Pines | 92014 | 37 | 28 | 24 | 278 | $172,000 | 16% |
| Scripps Miramar Ranch | 92131 | 27 | 19 | 22 | 209 | $97,000 | 19% |
| Carmel Valley | 92130 | 26 | 20 | 16 | — | $130,000 | 23% |
| Black Mountain Ranch | 92127 92101 | 18 | 12 | 10 | — | $180,000 | 11% |
| Otay Mesa | 92154 | 18 | 15 | 13 | — | $71,000 | 67% |
| Mission Beach | 92109 | 15 | 12 | 7 | — | $205,000 | 33% |
| Tierrasanta | 92124 | 15 | 15 | 10 | — | $82,000 | 27% |
| Del Mar Mesa | 92130 | 12 | 9 | 4 | — | $176,000 | 8% |
| Rancho Encantada | 92131 | 11 | 8 | 7 | — | $91,000 | 27% |
| Barrio Logan | 92113 | 9 | 7 | 5 | — | $83,000 | 33% |
| Carmel Mountain Ranch | 92128 | 8 | 5 | 7 | — | $92,000 | 38% |
| Pacific Highlands Ranch | 92130 | 8 | 7 | 4 | — | $64,000 | 25% |
| Sabre Springs | 92128 | 8 | 8 | 3 | — | $152,000 | 38% |
| Torrey Highlands | 92130 92129 | 6 | 4 | 5 | — | $146,000 | 17% |
| Old Town San Diego | 92110 | 4 | 3 | 1 | — | — | 25% |
| Torrey Hills | 92130 | 4 | 1 | 4 | — | — | 50% |
| Downtown | 92101 | 3 | 3 | 1 | — | — | 100% |
| Kearny Mesa | 92111 92123 | 3 | 3 | 2 | — | — | 67% |
| Midway-Pacific Highway | 92110 | 2 | 2 | 1 | — | — | 50% |
| Miramar Ranch North | 92131 | 2 | 2 | 1 | — | — | 50% |
BY ZIP CODE
32 ZIP codes.
ZIP codes and community plan areas overlap, so a ZIP's communities are the two that hold most of its projects. 93 projects have no ZIP on the parcel record and appear only in the community table.
| ZIP | Communities | Projects | Applications | Permits issued | Median days | Median value | Conversion |
|---|---|---|---|---|---|---|---|
| 92115 | College Area · Mid-City: Eastern Area | 494 | 398 | 347 | 212 | $168,000 | 46% |
| 92117 | Clairemont Mesa | 444 | 336 | 295 | 235 | $152,000 | 35% |
| 92105 | Mid-City: City Heights · Mid-City: Eastern Area | 435 | 344 | 279 | 235 | $131,000 | 42% |
| 92114 | Encanto Neighborhoods · Skyline-Paradise Hills | 411 | 330 | 219 | 238 | $139,000 | 37% |
| 92104 | North Park · Mid-City: City Heights | 335 | 249 | 207 | 292 | $123,000 | 48% |
| 92109 | Pacific Beach · Mission Beach | 305 | 239 | 191 | 273 | $184,000 | 38% |
| 92102 | Southeastern San Diego · Greater Golden Hill | 291 | 224 | 176 | 319 | $140,000 | 40% |
| 92126 | Mira Mesa | 284 | 238 | 208 | 174 | $145,000 | 29% |
| 92111 | Linda Vista · Clairemont Mesa | 274 | 219 | 174 | 232 | $176,000 | 29% |
| 92113 | Southeastern San Diego · Encanto Neighborhoods | 274 | 219 | 146 | 327 | $170,000 | 36% |
| 92116 | Mid-City: Normal Heights · North Park | 264 | 193 | 174 | 284 | $122,000 | 55% |
| 92107 | Peninsula · Ocean Beach | 259 | 206 | 159 | 229 | $155,000 | 36% |
| 92037 | La Jolla | 234 | 187 | 131 | 245 | $177,000 | 34% |
| 92154 | Otay Mesa-Nestor · Otay Mesa | 181 | 148 | 109 | 205 | $95,000 | 54% |
| 92103 | Uptown · North Park | 180 | 128 | 116 | 278 | $119,000 | 48% |
| 92110 | Clairemont Mesa · Linda Vista | 121 | 97 | 74 | 243 | $154,000 | 35% |
| 92139 | Skyline-Paradise Hills | 120 | 93 | 76 | 235 | $124,000 | 49% |
| 92106 | Peninsula | 114 | 86 | 68 | 265 | $148,000 | 40% |
| 92123 | Serra Mesa · Kearny Mesa | 112 | 93 | 75 | 183 | $124,000 | 44% |
| 92120 | Navajo · College Area | 107 | 92 | 70 | 157 | $107,000 | 43% |
| 92129 | Rancho Penasquitos · Torrey Highlands | 79 | 67 | 48 | 178 | $126,000 | 25% |
| 92122 | University | 67 | 48 | 49 | 178 | $129,000 | 37% |
| 92173 | San Ysidro · Otay Mesa-Nestor | 55 | 47 | 33 | 217 | $105,000 | 47% |
| 92119 | Navajo | 54 | 48 | 37 | 148 | $103,000 | 52% |
| 92130 | Carmel Valley · Del Mar Mesa | 48 | 34 | 29 | 227 | $145,000 | 25% |
| 92131 | Scripps Miramar Ranch · Rancho Encantada | 40 | 29 | 30 | 209 | $96,000 | 23% |
| 92128 | Rancho Bernardo · Carmel Mountain Ranch | 39 | 32 | 25 | 202 | $113,000 | 39% |
| 92014 | Torrey Pines | 36 | 27 | 23 | 287 | $157,000 | 17% |
| 92127 | Rancho Bernardo · Black Mountain Ranch | 34 | 24 | 18 | — | $118,000 | 27% |
| 92101 | Uptown · Downtown | 17 | 12 | 10 | — | $330,000 | 59% |
| 92124 | Tierrasanta | 15 | 15 | 10 | — | $82,000 | 27% |
| 92121 | Mira Mesa | 2 | 1 | 2 | — | — | 0% |
USE THE DATA
Download the tables.
Both tables as CSV, free to reuse with credit to Untapped Home and the City of San Diego. Reporters and researchers who want the project-level records or a cut for one neighborhood can write to us.
How the numbers are made
- Source. The City of San Diego Development Services permit approvals feed, files for approvals created and issued in 2024 and 2026, read on September 18, 2026. The City updates the feed continuously; this page is refreshed monthly.
- What counts as a project. One City project number with a building permit or combination building permit that adds an ADU or junior ADU. 5,013 projects carry the City's own ADU or junior ADU unit count on the permit. The other 805 have no unit count, and count because the written scope describes creating one: a new or proposed unit, a garage or room converted into one, a legalized unit. A permit that only mentions an ADU, such as a remodel of a house that already has one, a unit turned back into a garage, or the removal of an unpermitted unit, is left out. Electrical, plumbing and other trade permits on the same project are folded into it, so a project is counted once.
- The window. Projects with an approval created or issued from January 2024 to the September 18, 2026 read of the feed. Applications and permits issued are counted by their own dates inside that window, so a project applied for in 2024 and issued in 2025 counts as issued but not as an application. The chart shows complete months only, January 2024 through August 2026.
- Neighborhood. Each project's permit coordinates are placed in the City's community plan areas from the City planning map. ZIP codes come from the parcel record.
- Status. In review means no permit has issued and the application is still open. Finaled means the City closed the permit after final inspection. Cancelled, expired and withdrawn applications stay in the project count and out of the applications-in-review count.
- Values and times. Declared value is the construction value the applicant wrote on the permit; medians are shown where at least five projects declared one. Time to permit is the days from the application date to the issue date, shown where at least twenty permits issued.
Last complete month in the data: August 2026, 104 applications and 85 permits issued.
COMMON QUESTIONS
What homeowners ask next.
Which neighborhoods have the most ADU permits in San Diego?
By community plan area, Clairemont Mesa leads with 609 projects from January 2024 to September 18, 2026, followed by Mid-City: City Heights (401) and Southeastern San Diego (385). By ZIP code, 92115 leads with 494.
How long does an ADU permit take in San Diego?
Across the 3,653 permits issued since January 2024, the median was 235 days from application to permit. A quarter took 138 days or less and a quarter took more than 420 days. The community table shows the median for each area.
What does an ADU cost according to the permits?
The median declared construction value was $143,000. That is the figure the applicant wrote on the permit, which is often below the finished cost. Use it as a floor, and see our cost guide for what belongs in a full budget.
Is this the whole county?
No. This is the City of San Diego only, from the City's own permit records. Chula Vista, El Cajon, La Mesa, the unincorporated county and the other cities keep separate records.
How often is this page updated?
Monthly, from the City's permit feed. This edition was built from a September 18, 2026 read of the feed and covers January 2024 to September 18, 2026.
Can I use these numbers?
Yes. Quote or reuse the tables with credit to Untapped Home and the City of San Diego. If you need the project-level records, a cut for one neighborhood, or a quote, write to us.
YOUR PROPERTY IS THE NEXT QUESTION
Check your property for free.
Enter your address for a free Untapped Value Report on what an ADU could look like on your lot. No account or phone number needed.
Check my property